

The CPP and IQ: Are they "good enough" equivalent?
Part 1
By Paul Barrett
Of course not. In conversation, in presentations, in other test organization analysis reports using the CPP and usually their own ability tests, you often read or hear the claim that the CPP is no more than a glorified, too-long assessment of ‘g’ (general intelligence), which their own assessments already assess cheaper, easier, and quicker. Correlations between 0.3 and 0.6 are presented as evidence for that ‘good enough equivalence’.
From a mathematical-statistical perspective, it is easy to show how misguided and wrong is such claim. But what use is that if no-one familiar with mathematical-statistical terminology can understand a word of that exposition?
So, let’s do this as we would demonstrate anything else we might view as “obvious”; honestly, openly, and graphically. First, let’s take a look at what the CPP assesses in comparison to typical GMA (General Mental Ability), IQ-test abilities, and Critical Reasoning tests.
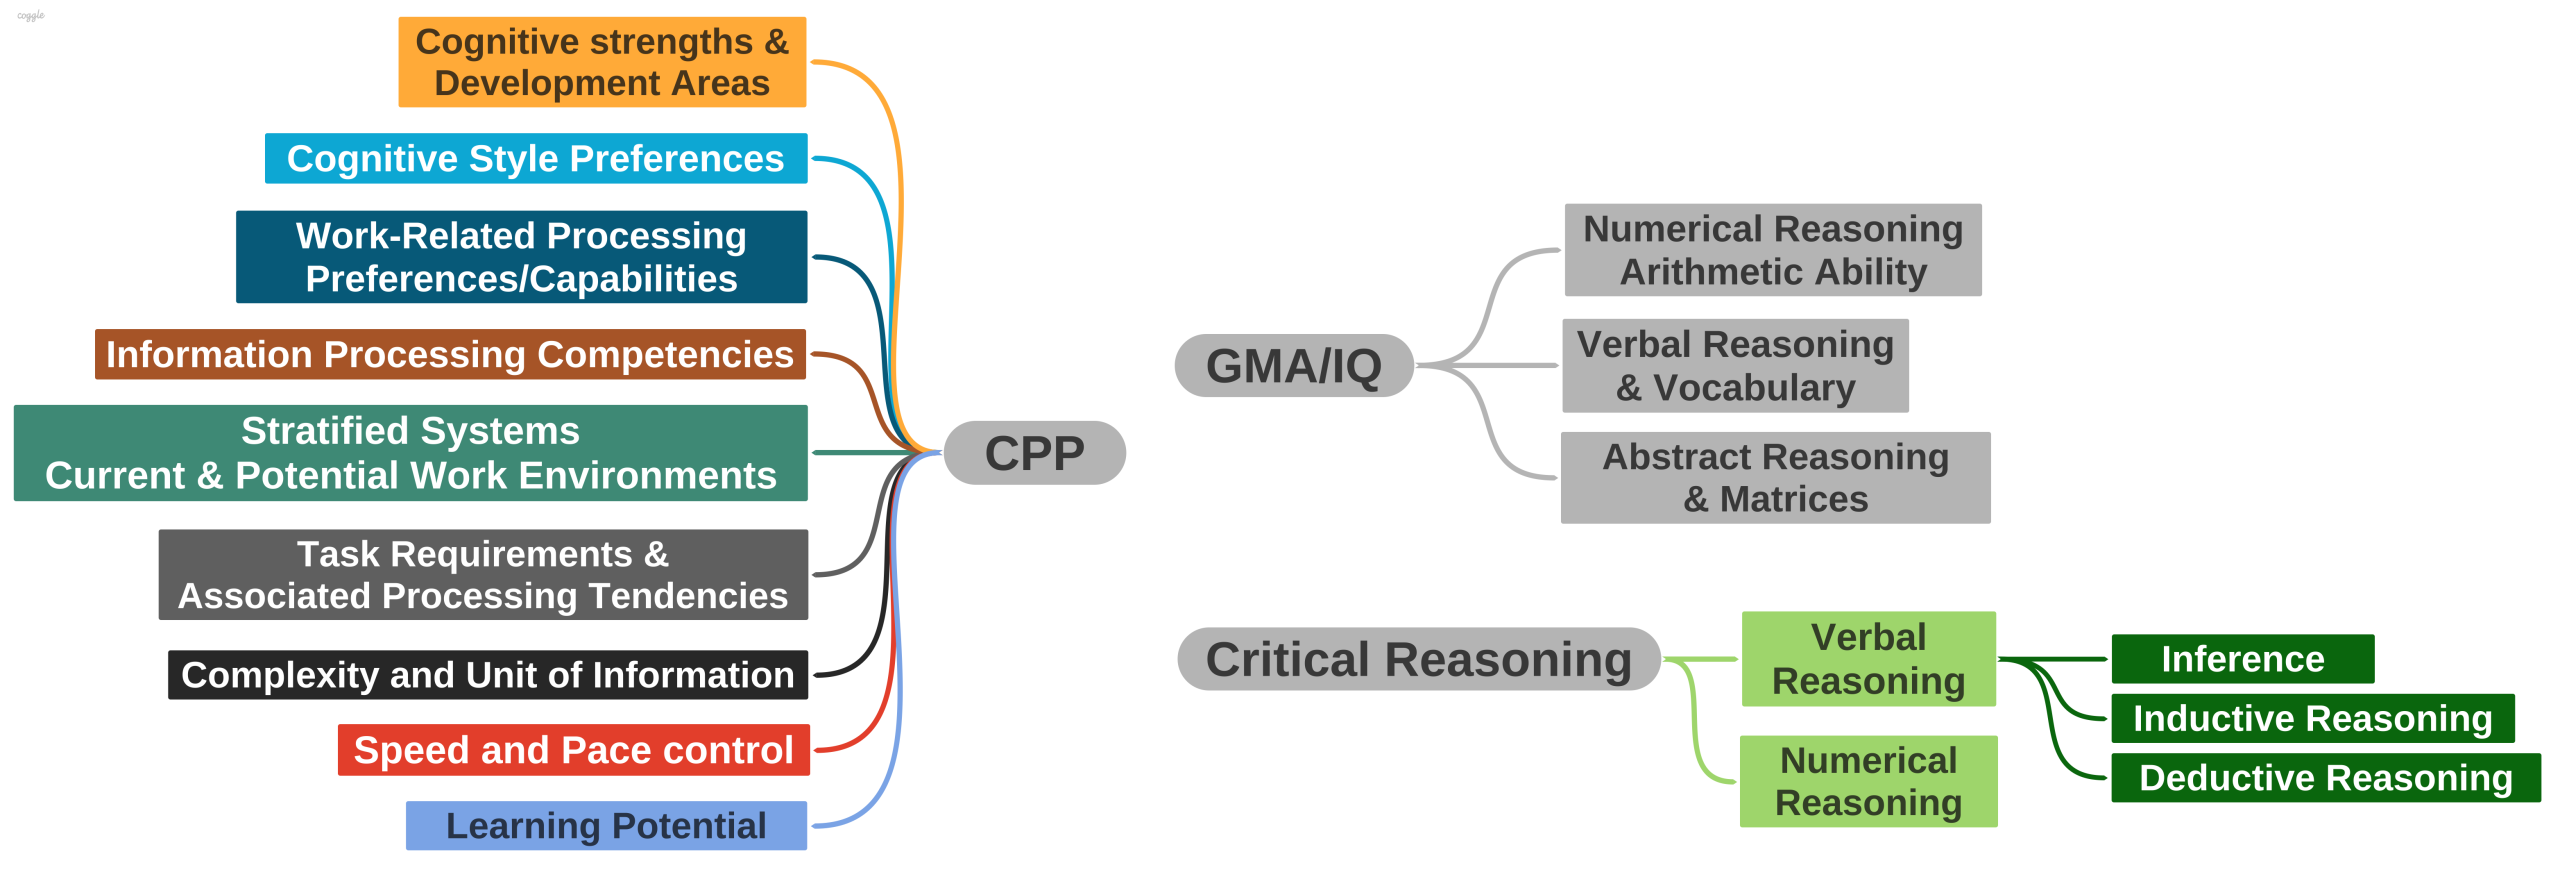
Just looking at the variety of information assessed by the CPP in comparison to IQ and Critical Reasoning, it’s pretty clear that some cognitive processes must be shared between them. it’s also pretty clear that the CPP is assessing psychological information that’s way beyond any “usual suspect” IQ test. The most important difference between the two approaches being that the CPP externalises and track thinking processes in a relatively unfamiliar and unstructured context and form part of the information Processing paradigm, whereas IQ tests measure “intellectual ability” through right and wrong answers to highly structured domain-related content as part of the Differential paradigm.
Now, we’ve already covered all this in our first big Cognadev Technical Analysis Report, correlating and comparing a variety of CPP attribute scores and category assignments with a gold-standard IQ test (the MAB:Multidimensional Aptitude Battery), Psytech International’s General Reasoning Test Battery-2 (GRT2), and their Critical Reasoning Test Battery (CRTB2). 29 pages packed full of necessary detail and technical information that probably causes immediate glazed-eye-syndrome in all but those whose day-job to is to critically evaluate such work.
For us right now, the key result is that magnitudes of correlations we computed varied between the two extremes of .27 and .64; the highest correlations being observed with the information processing competencies of the CPP, the lowest with Cognadev’s Current and Potential Levels of Work classification (based on Stratified Systems Theory).
I don’t want to fuss about what correlated with what and why it made sense (I’ve “been there, done that” in our Technical Report) but rather I wish to evaluate whether or not these coefficient magnitudes justify a claim of ‘equivalence’.
The easiest way to arrive at a judgement is to look at what a correlation of say 0.3 actually looks like. This can be achieved by generating a random sample of observations from a ‘population’ of data where the true population correlation between two variables is 0.3.
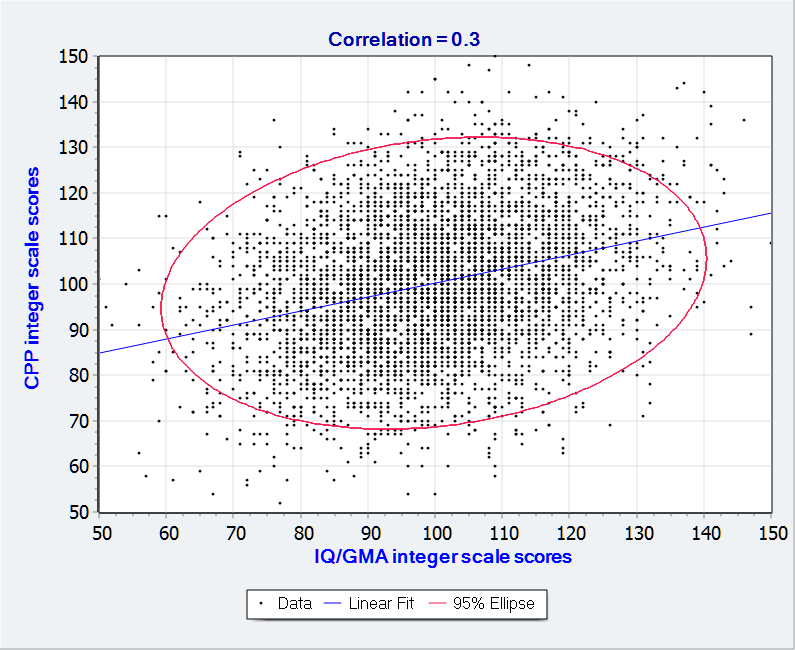
Equivalent? As the late famous Joyce Hogan of Hogan Assessments would say “GGMS: God Give Me Strength”. Why? Because look at the distribution of CPP scores when selecting cases with an IQ score equal to or greater than 115 (1 standard deviation above the IQ mean):
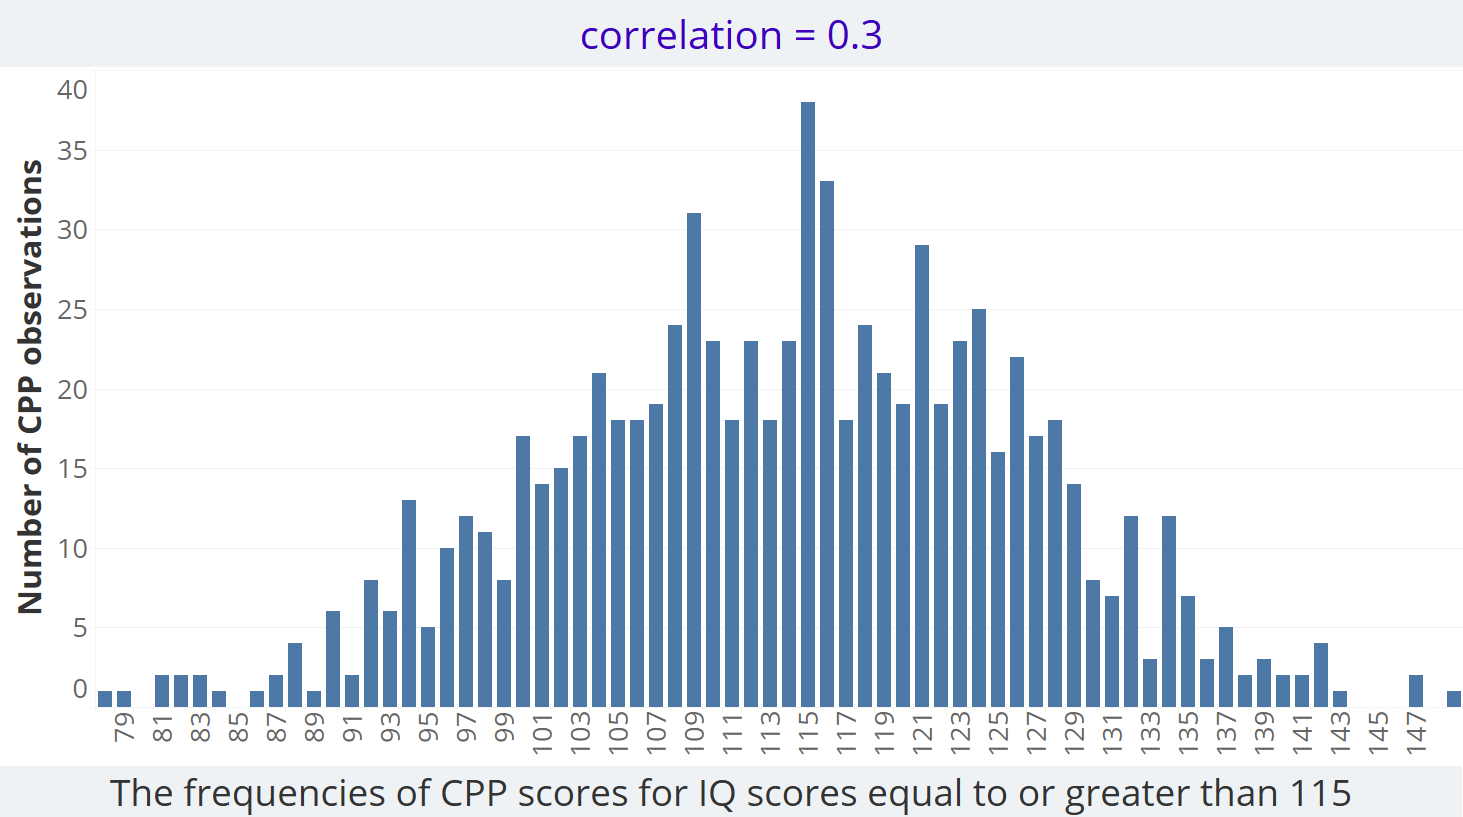
The CPP scores for these 829 high-IQ scores (=> 115) vary between 63 and 144. Nobody looking at this simple outcome graph could say (with a straight face at least!) that a CPP score is interchangeable/equivalent to IQ scores.
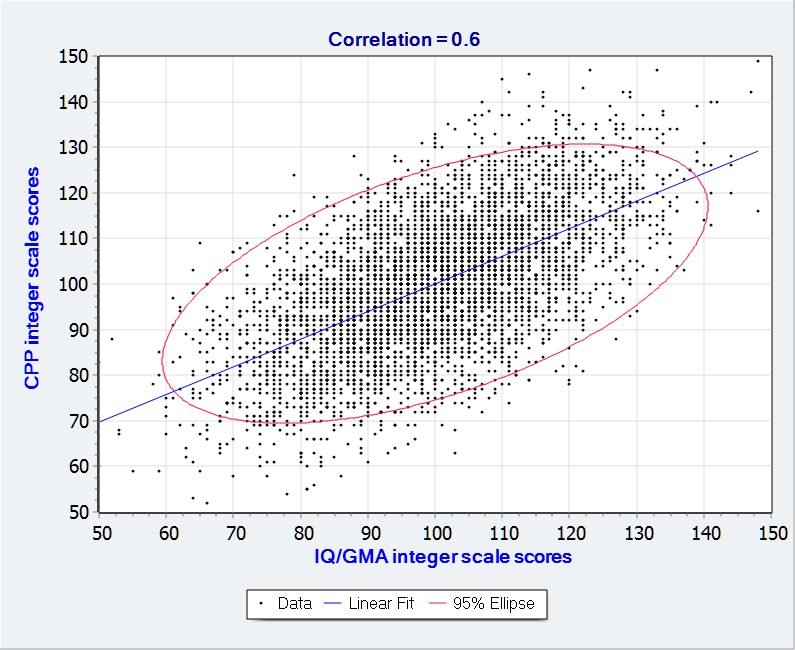
Better but hardly ‘equivalent’. Looking at the distribution of CPP scores when selecting cases with an IQ score equal to or greater than 115 (1 standard deviation above the IQ mean):
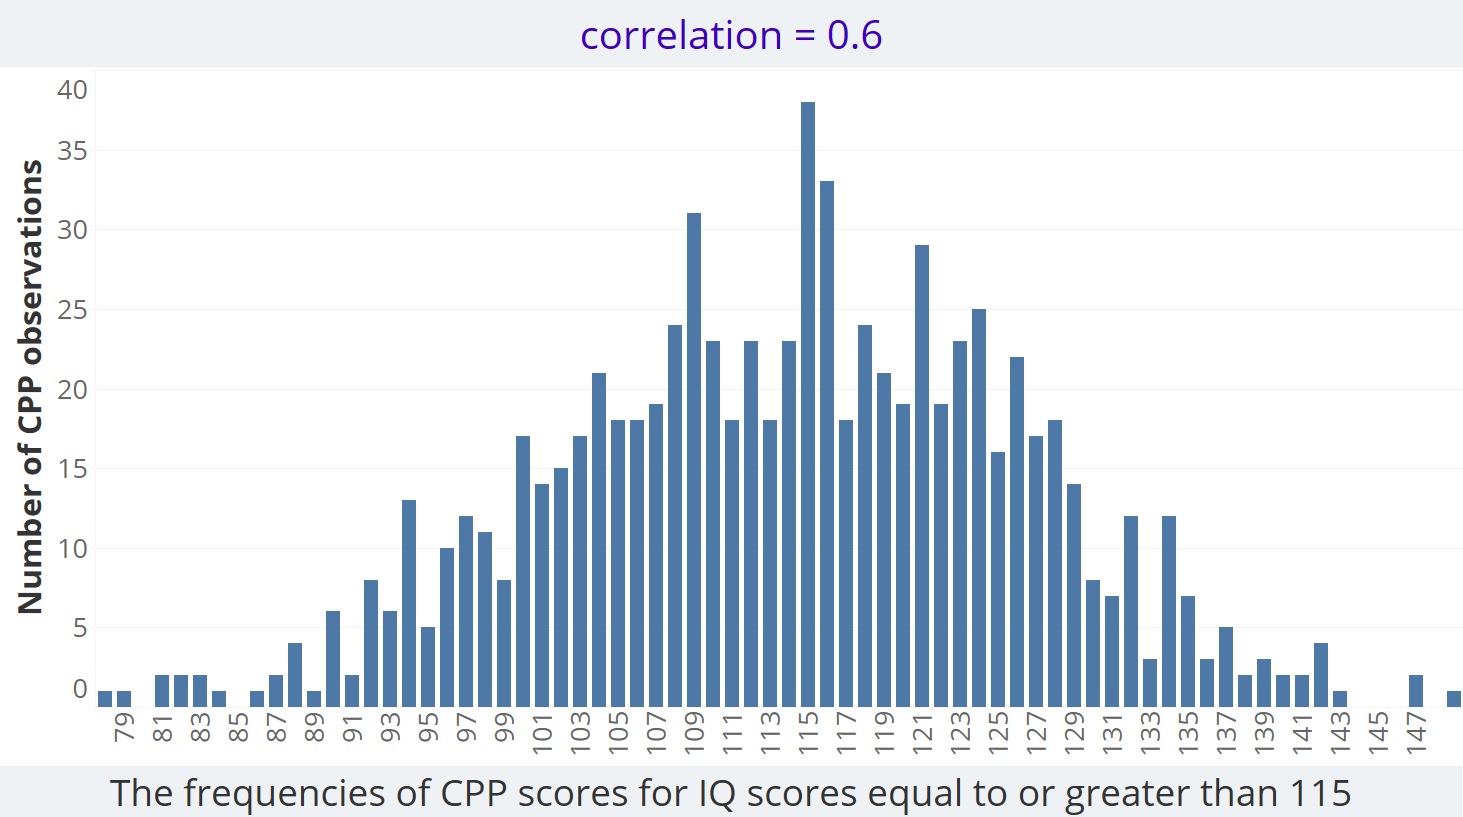
The CPP scores for these 807 high-IQ scores vary between 78 and 149. Hardly evidence for even a ‘good enough’ a claim of ‘equivalence’.
So, what does ‘probably good enough’ equivalence look like, the kind you can have confidence in when making that claim to someone else? Here I randomly sample 10,000 observations from a hypothetical ‘population’ distribution with a correlation of 0.95.
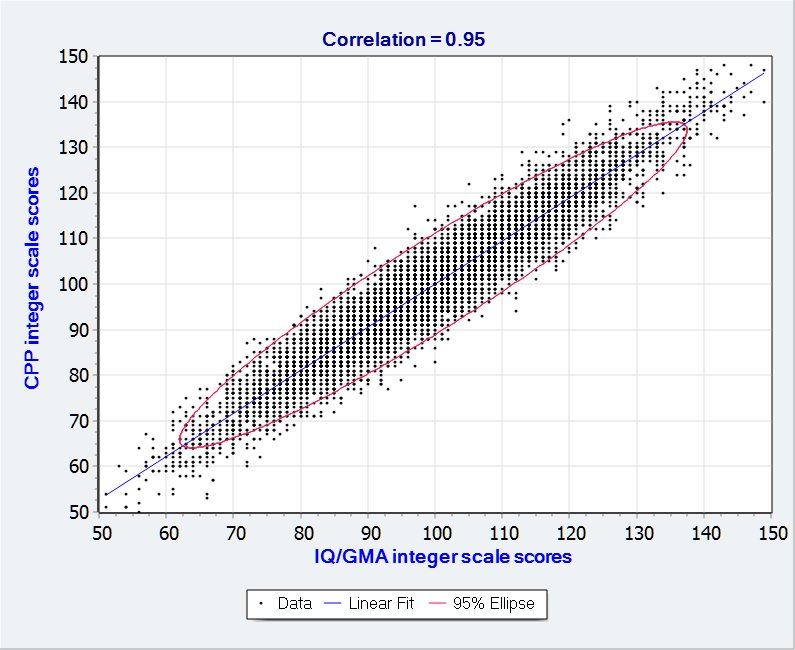
Looking at the distribution of hypothetical CPP scores when selecting cases with an IQ score equal to or greater than 115 (1 standard deviation above the IQ mean), we see:
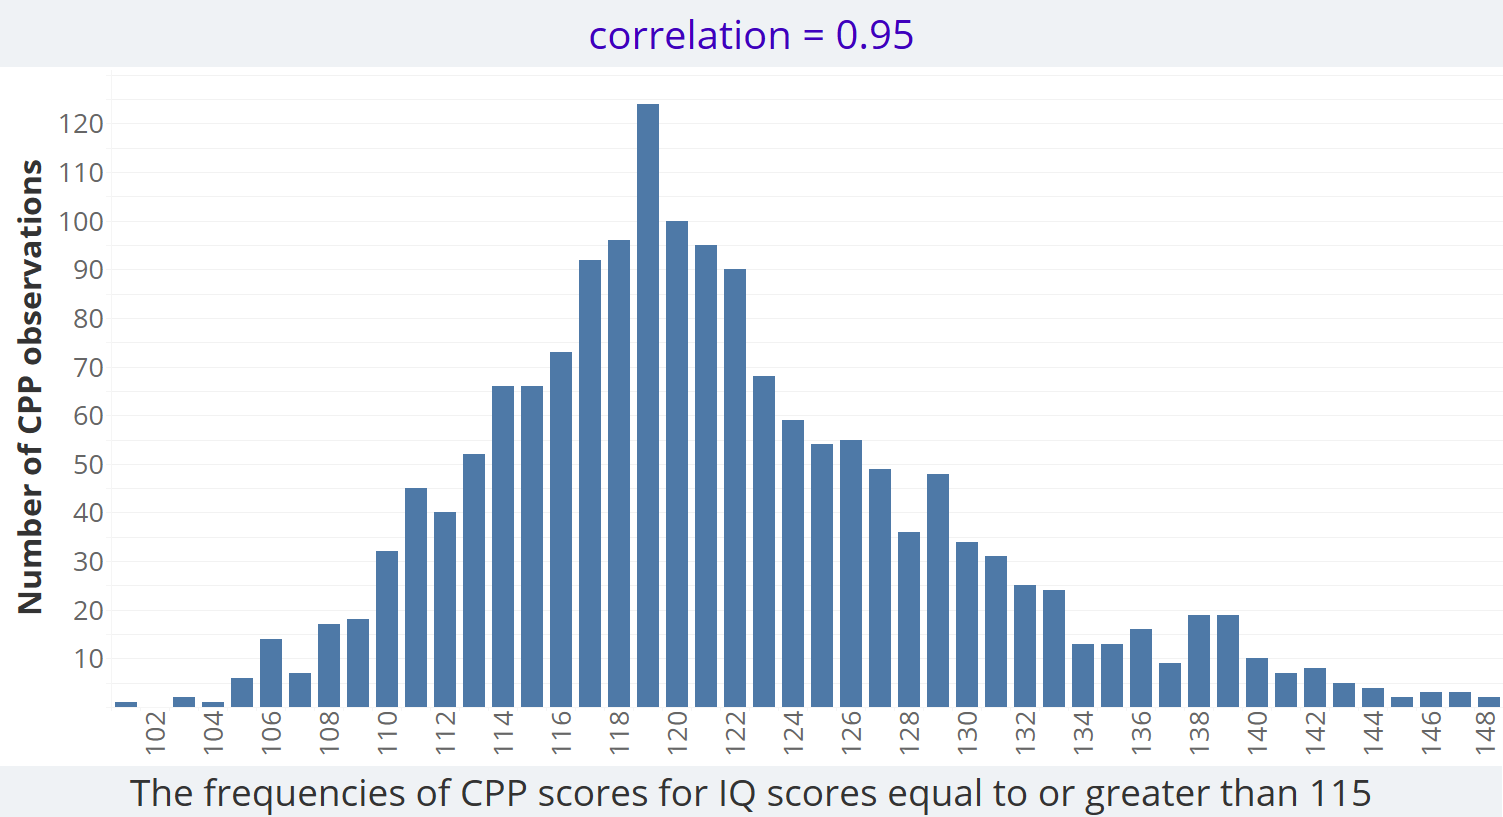
The hypothetical CPP scores for these 1,653 high-IQ scores vary between 101 and 129. If we look at say an IQ score of 115, and the distribution of these CPP scores with that specific IQ score, we see:
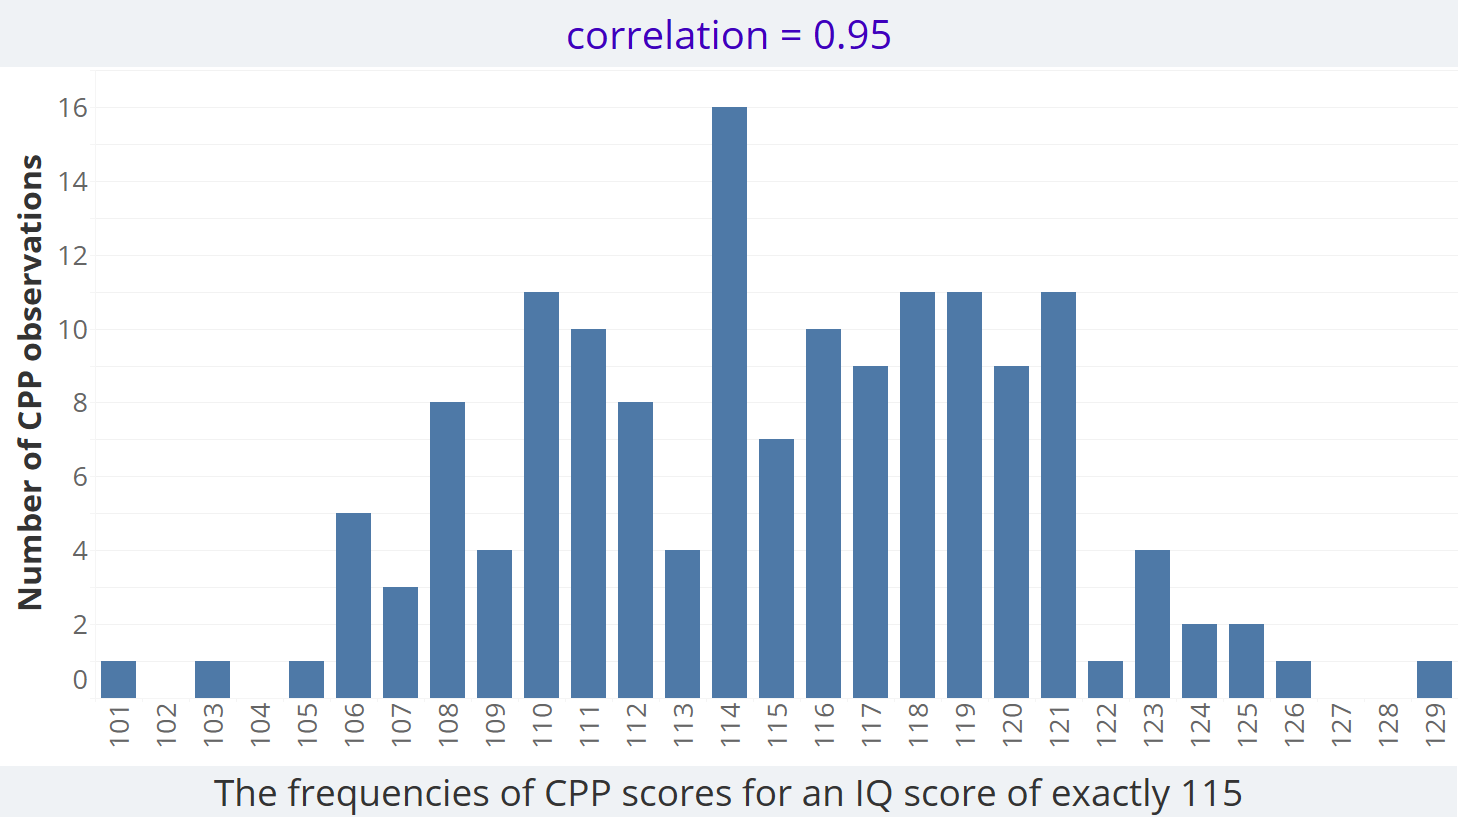
Not bad, still not exactly equivalent, but maybe ‘good enough’, especially when we might reasonably expect a bit of error due to the unreliability of scores.
Note: if you’d like to produce your own correlation scatterplots and cut-score analytics, or you just want to know how it’s all done, the CorViz programand/or the pdf program manual is free to download.